 During an April 25 conference call to unveil the Obama campaign's 50-state voter registration drive, deputy campaign manager Steve Hildebrand sounded genuinely exasperated as he tried to steer reporters to the topic at hand.
Despite his best efforts, those on the call didn’t request any further details about the effort. No one posed questions about the drive's goals or how the campaign thinks it could affect Obama’s general election prospects. Instead, they brought up the latest distractions: What does the campaign make of Jeremiah Wright’s new comments? Are advisers worried that Obama has a problem attracting working-class white voters? And so on.
The media’s lack of interest is hardly surprising. While voter registration drives are invaluable, they’re also dry and tedious – not that exciting to participate in or to write about.
But some new data indicates that, come November 5, we may find ourselves looking back at this year’s intensive voter mobilization efforts as what put Obama – and down-ballot Democrats nationwide – over the top.
The Poblano Model
This new data was generated by the anonymous 30-year-old author of the website FiveThirtyEight.com. A statistician and analyst, “Poblano” (who asked that his real name be kept private for professional reasons) has developed a sophisticated regression model that uses state-by-state polling data to assess possible general election outcomes in individual states.
“We weight the average based on the reliability of the pollster,” Poblano told me. “The polls that have a better track record are obviously going to be emphasized more heavily. We look at sample size. We look at how recent the poll was. We also skew various demographic factors as well.”
In the Frequently Asked Questions section of his site, Poblano lists the demographic variables that his model takes into account in each state. Included are John Kerry’s 2004 performance, the candidates’ respective fundraising efforts, and other factors such as income, race, religion, age, and education level.
Using the resulting baseline averages, Poblano runs simulations – 10,000 at a time – to determine the probability of either Obama or Hillary Clinton beating John McCain in the fall.
“The simulation takes the polls we have now and recognizes that this far out from the election there are a lot of uncertainties,” Poblano explained. “There was a point in time [in 1984] at which Walter Mondale led Ronald Reagan by 17 points or something. So we look at how much polls move over time, plus the margin of error in each poll, plus the fact that polls are never as good as they claim to be … And we just simulate around that.”
Poblano’s simulation engine has produced some fascinating results. According to his current data, the model predicts that Clinton would win four states against McCain that Obama is favored to lose (FL, AR, WV, OH). Meanwhile, Obama wins eight states where Clinton would likely fail (MI, WI, IA, CO, NM, NV, WA, OR).
Using his simulation engine, Poblano went way against the grain last Monday, predicting that Obama would win the North Carolina primary by 17 points (most expected him to win by a single-digit margin). The following day, Obama took the state by 14.
Poblano’s Indiana projection was even more spot on. He predicted a 51-49 Clinton victory. And sure enough, that’s what happened.
Later in the week, pollster Mark Blumenthal devoted his National Journal column to the “Poblano Model,” noting that it had outperformed five major national polling operations in predicting the results of Tuesday’s primaries.
Increasing African-American Turnout
Recently, Progress Illinois and the SEIU Illinois Council (which sponsors us) asked Poblano to examine how incremental increases in turnout among certain demographic groups would affect the outcome of an Obama-McCain contest. What he found underscores the importance of voter mobilization this year. (You can find Poblano’s own analysis here.)
Take the African-American vote, for example. With each 10 percent increase in black turnout nationwide, Obama gains an average of 13 electoral votes, while his chance of winning jumps by about eight points:
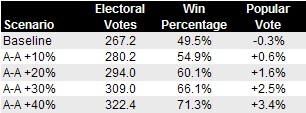
Poblano generated these projections by taking his current McCain-vs.-Obama polling averages and creating a baseline prediction assuming 2004 levels of turnout, which now gives Obama a 49.5 percent chance of winning.
He then added more African-American voters to the model in 10 percent increments, having them break 94 percent for Obama and 6 percent for McCain (which reflects average head-to-head polling). Finally, he ran simulations at each threshold, which produced corresponding win percentages and electoral vote splits.
Examining the full results, you can see a handful of states turn from red to purple – or from purple to blue – as African-American turnout increases.
The Rust Belt states are the first to catch your eye. According to the baseline, if 2008 turnout levels mirror those in 2004, McCain is predicted to win Ohio by 1.6 percent. But when you increase African-American voters by 20 percent, the state tips towards Obama, giving him a 0.3 percent margin of victory. Push that up to 30 and 40 percent and his edge increases to 1.2 and 2.1 percent, respectively.
Meanwhile, in neighboring Pennsylvania, a 30 percent hike in black turnout would boost Obama’s predicted margin of victory from 1.3 to 3.4 percent, and in Michigan from 1.3 to 4.4 percent.
Other states where Obama stands to benefit the most from increased African-American turnout are North Carolina and Virginia. Poblano’s baseline predicts a 6.6 percent margin of victory for McCain in North Carolina. But if you hike black turnout by 30 percent, that margin shrinks to just 0.9 percent. And when you reach a 40 percent increase, Obama takes the state.
Virginia follows much the same trend. A 30 percent increase in turnout slices McCain’s margin of victory from 4.5 to 0.5 percent. And once again, at the 40 percent level, Obama wins. (To see the estimate number of unregistered African-Americans in these states, click here.)
Poblano also points to South Carolina, Florida, and Georgia as states that could suddenly be in play with a significant increase in black turnout: “There are scenarios where you could really have – not a landslide – but Obama winning 350-plus electoral votes … just with a mild increase in African-American turnout.”
The Latino And Youth Votes
Just as he did with African-Americans, Poblano used his regression model and simulation engine to examine how increases in turnout among two other crucial demographics -- 18-24 year-olds and Latino voters -- would affect Obama’s electoral prospects.
While under 50 percent of both these groups voted in 2004, their participation is expected to improve significantly this year. Young voters are more enthusiastic than ever. Meanwhile, efforts to mobilize the Latino population have so far proved very successful this primary season.
Poblano found that increasing the youth vote by 25 percent would give Obama 16 additional electoral votes and boost his chance of beating McCain by nearly 7 percent (assuming that this group breaks 70-30 towards Obama):
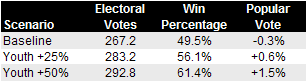
While 18-24 year-olds are spread rather evenly across all 50 states, Poblano points to Wisconsin, Iowa, and Minnesota as states with traditions of high youth turnout. His baseline currently has them all in Obama’s column. But if young voters flock to the polls come November – as they’re expected to – these three states could end up far out of McCain’s reach.
Compared to African-Americans and 18-24 year-olds, the Latino vote doesn’t break as heavily towards Obama. Poblano’s baseline assumes a 60-40 split in Obama’s favor and each 25 percent increase in turnout boosts his chances of beating McCain by a little under 3 percentage points:

Nonetheless, when it comes to certain Southwestern states, boosting Latino turnout is going to be crucial for the Obama campaign. Take New Mexico, for example. While Poblano’s baseline has Obama winning by 1.2 percent there, a 40 percent increase in the Latino vote would increase that margin to 4.9 percent. Similar turnout levels in Colorado would push his margin from 1.3 up to 2.4 percent. In Nevada, meanwhile, it would climb from 2.0 to 3.1 percent.
The Full Monty
Of course, to really understand the ramifications of Obama’s 50-state registration drive and the unprecedented excitement surrounding his campaign, you have to look at how increased turnout across all three of these groups could tilt the electoral map in his favor.
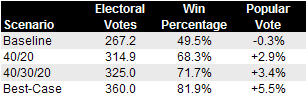
So Poblano devised several possible scenarios. The first, titled the “40/20 Plan,” increases the youth vote by 40 percent and the African-American vote by 20 percent, while keeping the Latino vote at the 2004 level. The “40/30/20 Plan” projects a 40 percent increase among 18-24 year-olds, a 30 percent increase among Latinos, and a 20 percent in increase in the black vote. Finally comes the “Best Case Scenario,” which assumes a 40 percent increase among African-Americans and a 50 percent increase in both the youth and Latino vote nationally.
The “40/20 Plan” alone increases Obama’s chances of winning from 49.5 percent to 68.3 percent. The “40/30/20 Plan,” meanwhile, lifts this probability over 70 percent:
These projections illustrate the extraordinary level of flexibility enjoyed by the Obama campaign as they head towards the general election. Rather than focusing on simply winning Ohio, Pennsylvania, and Michigan, they have a big enough war chest and a broad enough base of support to create all sorts of contingencies in case one of those typical battleground states goes for McCain.
“If Obama wins the traditional big three, he’s going to have a tough time losing anyway,” Poblano said. “But now you give him a margin for error where if something goes wrong in Ohio – if you’re winning North Carolina and Iowa and Colorado, it’s a very robust scenario for him with a lot of Plan A's, Plan B's, and Plan C's to win the election.”
While the media has often focused on Obama’s star power, his success is largely the result of a campaign team that, through thick and thin, keeps its eye on the big picture. In late 2007, the Clinton camp believed that a slew of primary victories on February 5 were all they needed to cinch the nomination. By contrast, Obama’s advisers focused on the half of the country that wasn’t voting that day. In the end, it was their intensive organizing in states like Idaho, Kansas, and Colorado that brought Obama to the threshold of the nomination.
With the launch of “Vote For Change" in 50 states yesterday, it’s clear that the Obama campaign still has the big picture in mind. And if Poblano’s projections are accurate, it’s going to be quite an adventure.
ADDENDA
For those interested in the raw, state-to-state numbers, you can download Poblano's Excel spreadsheet here. To experiment with different scenarios, just change the turnout numbers in the yellow section at the top of the page. To recalculate, hit F9 on a PC, or Command + = on a Mac.
For more information on the estimated number of unregistered African-American, Latino, and 18-24 year-old voters in the states mentioned in this article, check out this spreadsheet, or download it here.
Finally, be sure to check out this Q&A posted by Poblano on his methodology.


No comments:
Post a Comment